Why is it important to measure operability? What should the trailing indicators and leading indicators of operability?
TL;DR:
- The trailing indicators of operability are availability rate and time to restore availability.
- The leading indicators of operability include the frequency of Chaos Days and the time to act upon incident review findings.
Introduction
In How To Measure Anything, Douglas Hubbard states organisations have a Measurement Inversion, and waste their time measuring variables with a low information value. This is certainly true of IT reliability, which is usually badly measured if at all. By proxy, this includes operability as well.
In many organisations, reliability is measured by equating failures with recorded production incidents. Incident durations are calculated for Mean Time Between Failures (MTBF) and Mean Time To Repair (MTTR), or there is just an overall incident count. These are classic vanity measures. They are easy to implement and understand, but they have a low information value due to the following:
- Quantitative measures such as incident count have no reflection on business drivers, such as percentage of unrecoverable user errors
- Manual recording of incidents in a ticket system can be affected by data inaccuracies and cognitive biases, such as confirmation bias and recency bias
- Goodhart’s Law means measuring incidents will result in fewer incident reports. People adjust their behaviours based on how they are measured, and measuring incidents will encourage people to suppress incident reports with potentially valuable information.
If operability is to be built into applications, there is a need to identify trailing and leading indicators of operability that are holistic and actionable. Measures of operability that encourage system-level collaboration rather than individual productivity will pinpoint where improvements need to be made. Without those indicators, it is difficult to establish a clear picture of operability, and where changes are needed.
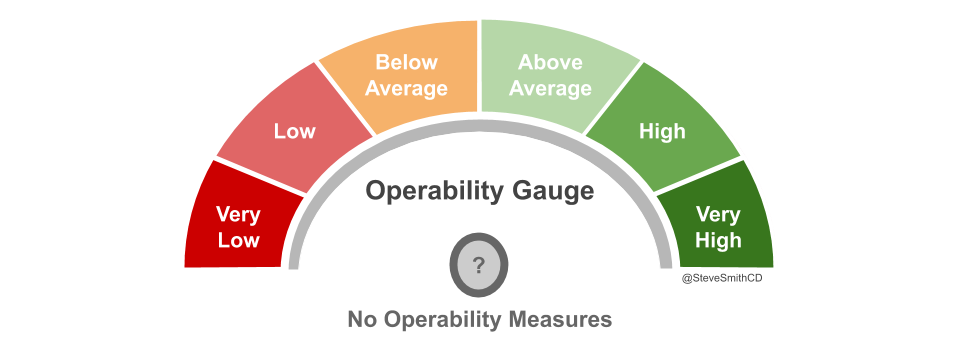
Effective leading and trailing indicators of software delivery should be visualised and publicly communicated throughout an organisation, via internal websites and dashboards. Information radiators help engineers, managers, and executives understand at a glance the progress being made and alignment with organisational goals. Transparency also reduces the potential for accidents and bad behaviours. As Louis Brandeis said in Other People’s Money “sunlight is said to be the best of disinfectants; electric light the most efficient policeman”.
Availability as a trailing indicator
Failures should be measured in terms of application availability targets, not production incidents. Availability measurements are easy to implement with automated time series metrics collection, easy to understand, and have a high information value. Measurements can be designed to distinguish between full and partial degradation, and between unrecoverable and recoverable user errors.
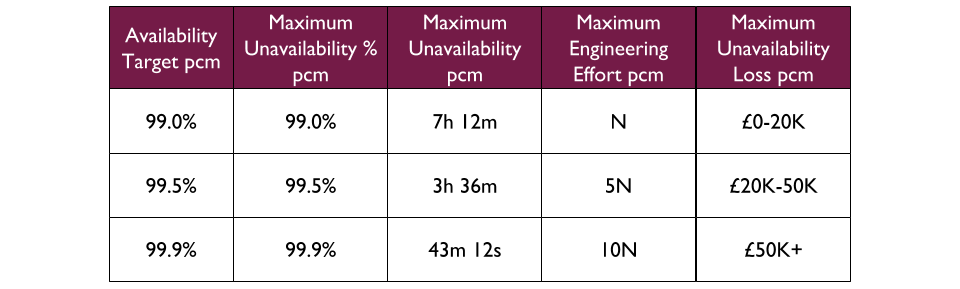
For example, a Fruits R Us organisation has 99.0%, 99.5%, and 99.9% as its availability targets A product manager for an Oranges application selects 99.5% for at least the first 3 months.
Availability should be measured in the aggregate as Request Success Rate, as described by Betsey Beyer et al in Site Reliability Engineering. Request Success Rate can approximate degradation for customer-facing or back office applications, provided a well-defined notion of successful and unsuccessful work. It covers partial and full downtime for an application, and is more fine-grained than uptime versus downtime.
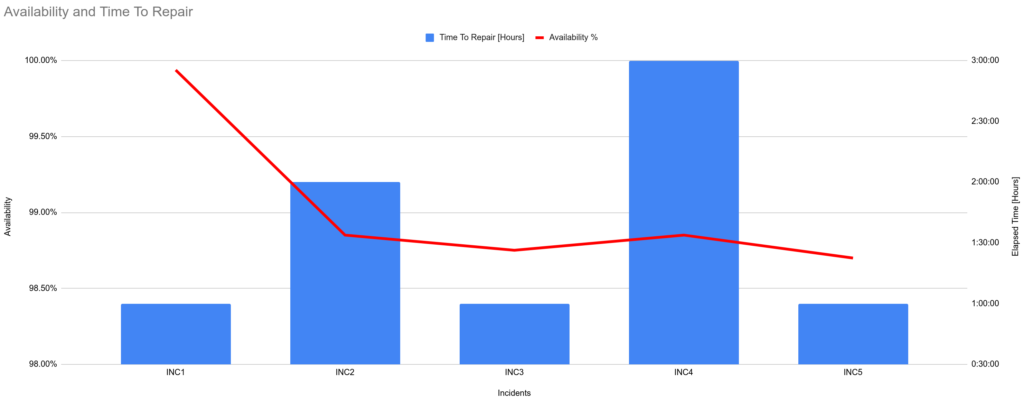
When an application has a Request Success Rate lower than its availability target, it is considered a failure. The average time to restore availability can be tracked as a Mean Time To Repair metric, and visualised in a graph alongside availability.
At Fruits R Us, the Oranges application communicates with upstream consumers via a HTTPS API. Its availability is constantly measured by Request Success Rate, which is implemented by checking the percentage of upstream requests that produce a HTTP response code lower than HTTP 500. When the Request Success Rate over 15 minutes is lower than the availability target of 99.5%, it is considered a failure and a production incident is raised. An availability graph can be used to illustrate availability, incidents, and time to repair as a trailing indicator of operability.
Leading indicators of operability
Failures cannot be predicted in a production environment as it is a complex, adaptive system. In addition, it is easy to infer a false narrative of past behaviours from quantitative data. The insights uncovered from an availability trailing indicator and the right leading indicators can identify inoperability prior to a production incident, and they can be pattern matched to select the best heuristic for the circumstances.
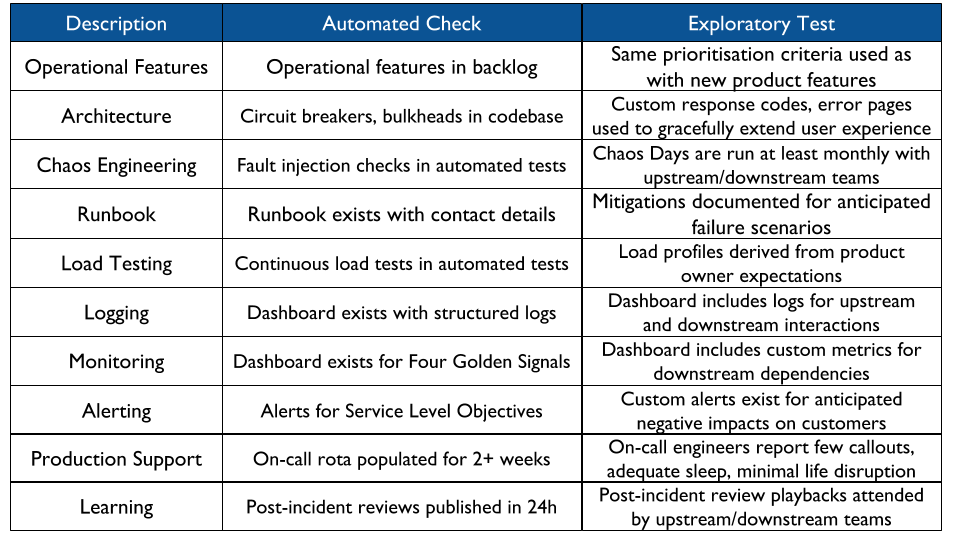
A leading indicator should be split into an automated check and one or more exploratory tests. This allows for continuous discovery of shallow data, and frees up people to examine contextual, richer data with a higher information value. Those exploratory tests might be part of an operational readiness assessment, or a Chaos Day dedicated to particular applications. Leading indicators of operability can include:
Learning is a vital leading indicator of operability. An organisation is more likely to produce operable, reliable applications if it fosters a culture of continuous learning and experimentation. After a production incident, nothing should be more important than everyone in the organisation having the opportunity to accumulate new knowledge, for their colleagues as well as themselves.
The initial automated check of learning should be whether a post-incident review is published within 24 hours of an incident. This is easy to automate with a timestamp comparison between a post-incident review document and the central incident system, easy to communicate across an organisation, and highly actionable. It will uncover incident reviews that do not happen, are not publicly published, or happen too late to prevent information decay.
Another learning check should be the throughput of operability tasks, comprising the lead time to complete a task and interval between completing tasks. Tasks should be created and stored in a machine readable format during operability readiness assessments, Chaos Days, exploratory testing, and other automated checks of operability. Task lead time should not be more than a week, and task interval should not exceed the fastest learning source. For example, if operability readiness assessments occur every 90 days and Chaos Days are 30 days then at least one operability task should be completed per month.
Acknowledgements
Thanks as usual to Thierry de Pauw for reviewing this series
Recent Comments