Use Cost of Delay to value Continuous Delivery features
When building a Continuous Delivery pipeline, we want to value and prioritise our backlog of planned features to maximise our return on investment. The time-honoured, ineffective IT approach of valuation by intuition and prioritisation by cost is particularly ill-suited to Continuous Delivery, due to its focus upon one-off infrastructure improvements to enable product flow. How can we value and prioritise our backlog of planned pipeline features to maximise economic benefits?
To value our backlog, we can calculate the Cost of Delay of each feature – its economic value over a period of time if it was immediately available. Described by Don Reinertsen as “the golden key that unlocks many doors“, Cost of Delay can be calculated by quantifying the value of change or the cost of the status quo via the following economic benefit types:
- Increase Revenue – improve profit margin
- Protect Revenue – sustain profit margin
- Reduce Costs – reduce costs currently incurred
- Avoid Costs – reduce costs potentially incurred
Cost of Delay allows us to quantify the opportunity cost between a feature being available now or later, and using money as the unit of measurement transforms stakeholder conversations from cost-cutting to delivering value. Calculation accuracy is less important than the process of collaborative information discovery, with assumptions and probabilities preferably co-owned by stakeholders and published via information radiator.
Cost of Delay = economic value over time if immediately available
To prioritise our backlog, we can use Cost of Delay Divided By Duration (CD3) – a variant of the Weighted Shortest Job First scheduling policy. With CD3 we divide Cost of Delay by duration, with a higher score resulting in a higher priority. This is an effective scheduling policy as the duration denominator promotes batch size reduction.
CD3 = Cost of Delay / Duration
As the goal of Continuous Delivery is to decrease cycle time by reducing the transaction cost of releasing software, a pipeline feature will likely yield an Avoid Cost or Reduce Cost benefit intrinsically linked to release cadence. We can therefore calculate the Cost of Delay as one of the below:
- Reduce Cost: Automate action(s) to decrease wait times within release processing time
= (wait time in minutes / cycle time in days) * minute price in £
- Avoid Cost: Automate action(s) to decrease probability of repeating release processing time due to rework
= (processing time in minutes / cycle time in days) * minute price in £ * % cost probability per year
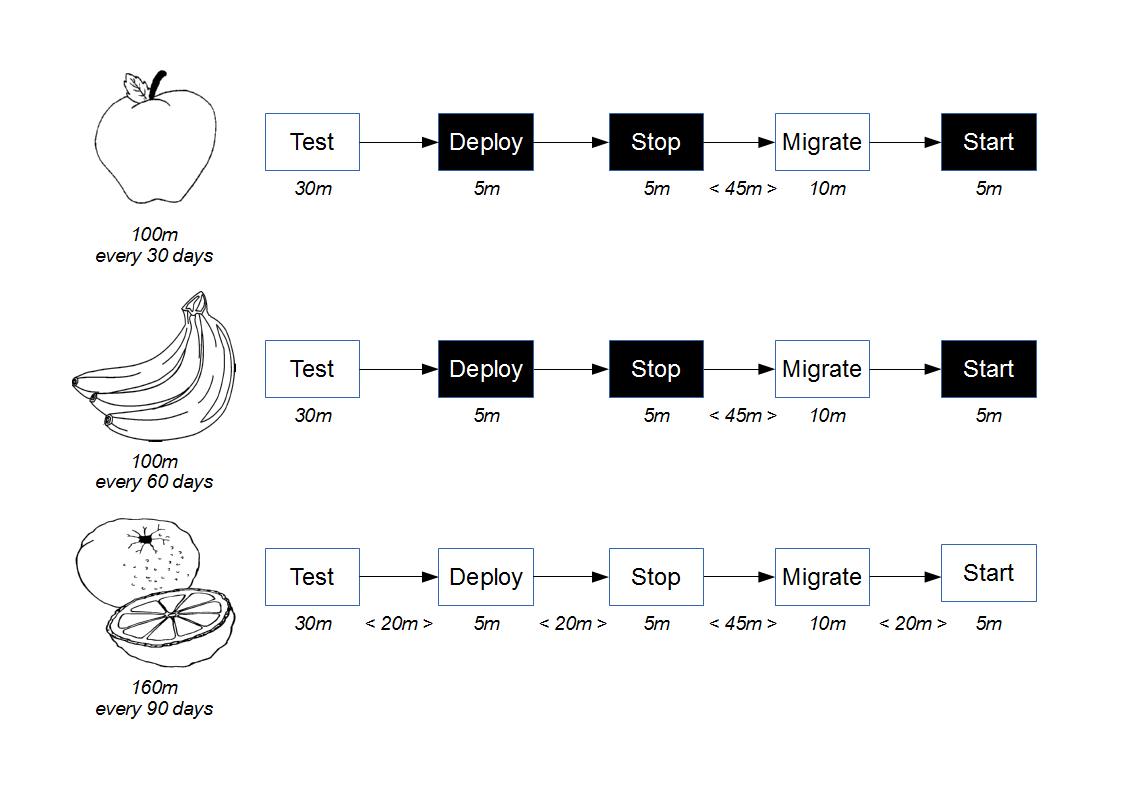
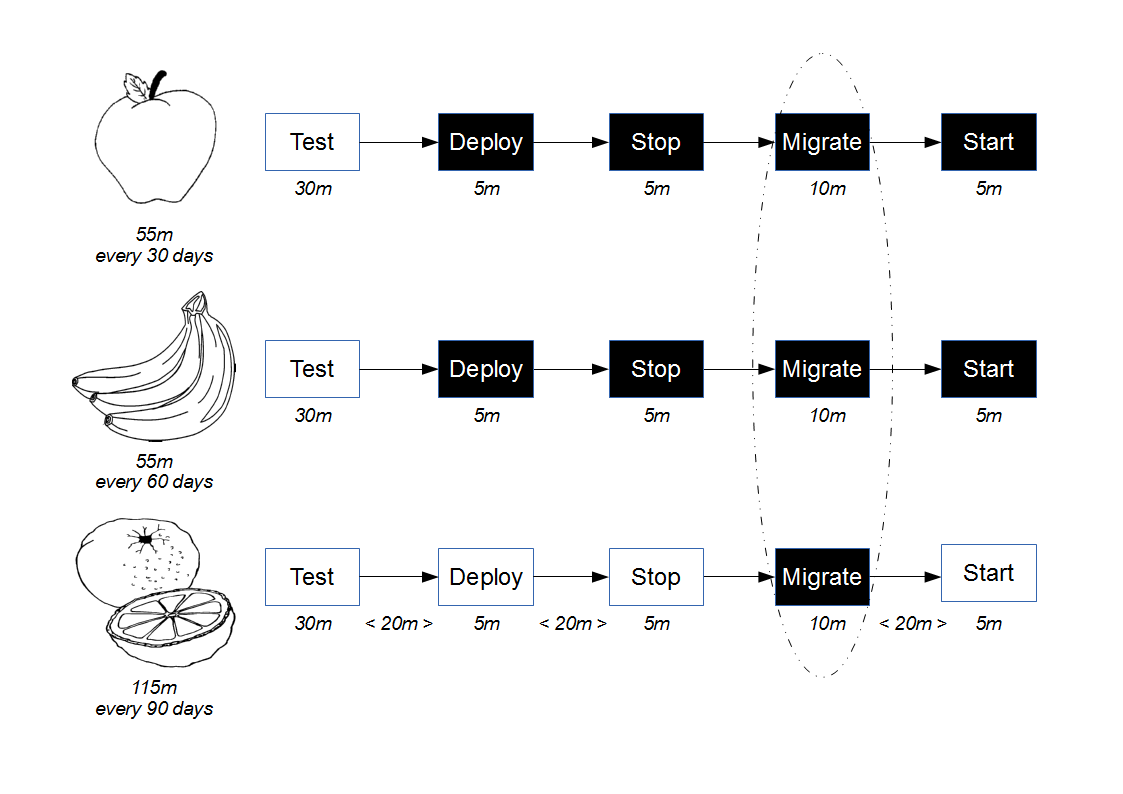
For example, consider an organisation building a Continuous Delivery pipeline to support its Apples, Bananas, and Oranges applications by fully automating its release scripts. The rate of business change is variable, with an Apples cycle time of 1 month, a Bananas cycle time of 2 months, and an Oranges cycle time of 3 months. Our pipeline has already fully automated the deploy, stop, and start actions for our Apples and Bananas applications but lacks support for our Oranges application, our test framework, and our database migrator.
 Once our development team have provided their cost estimates, how do we determine which feature to implement next without resorting to intuition?
 We begin by agreeing with our pipeline stakeholders an arbitrary price for a minute of our time of £10000, and calculate the Cost of Delay for supporting the Oranges application as:
= (wait time / cycle time) * minute price
= (20 + 20 + 20 / 90) * 10000
= 0.67 * 10000
= £6700 per day
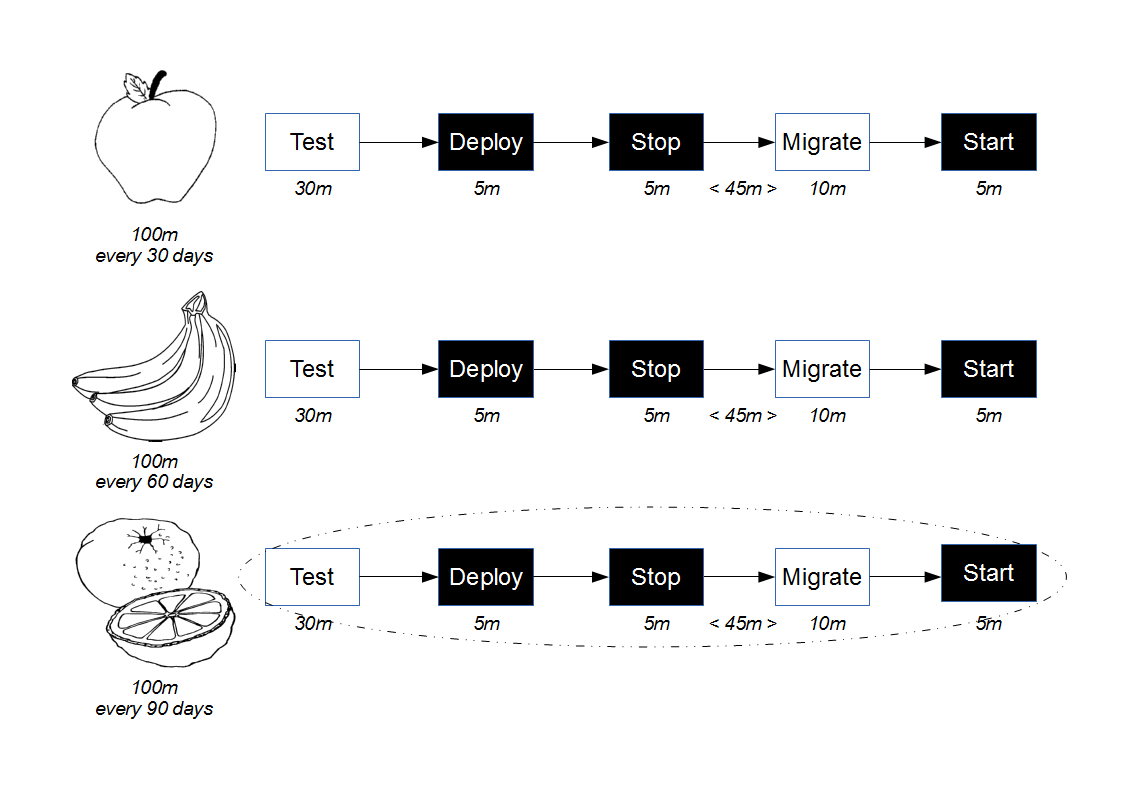
Given the test framework has failed twice in the past year and caused a repeat of release processing time specifically due to its lack of pipeline support, the Cost of Delay is:
= (100 / months in a year) * occurrences
= (100 / 12) * 2
= 16% cost probability per year
= (processing time / cycle time) * minute price * % cost probability
= ((100 / 30) + (100 / 60) + (160 / 90)) * 10000 * 16%
= 6.78 * 10000 * 16%
= £10848 per day (£5328 Apples, £2672 Bananas, £2848 Oranges)
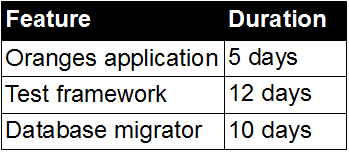
The Cost of Delay for supporting the database migrator is:
= (wait time / cycle time) * minute price
= ((45 / 30) + (45 / 60) + (45 / 90)) * 10000
= 2.75 * 10000
= £27500 per day (£15000 Apples, £7500 Bananas, £5000 Oranges)
Now that we have established the value of the planned pipeline features, we can use CD3 to produce an optimal work queue. CD3 confirms that support for the database migrator is our most urgent priority:
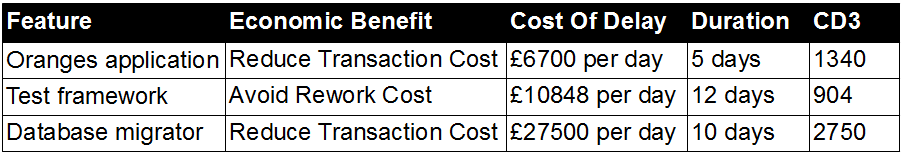
This example shows that using Cost of Delay and CD3 within Continuous Delivery validates Mary Poppendieck’s argument that “basing development decisions on economic models helps the development team make good tradeoff decisions“. As well as learning support for the database migrator is twice as valuable as any current alternative, we can offer new options to our pipeline stakeholders – for example, if an Apples-specific database migrator required only 5 days, it would become our most desirable feature (£15000 per day / 5 days = CD3 score of 3000).
Hi Stephen,
Thank you for posting this – this is an important topic, and something which very few people are applying in the ‘real’ world (in my experience).
I’d be interested in your thoughts on how to apply the above to the many different shapes of COD we face in the field.
For example, a change to adhere to a new regulatory requirement could be termed as having a cost of delay of zero until the legislation becomes effective, at which point the cost may be a large fine, or the shutting down of a related revenue generating activity (at which point the cost is a step or is linear as per the projected loss of that revenue stream).
There are other shapes – for example degenerative COD where the cost of delay of a feature may be $1000 in lost potential revenue next week as you’ll be first to market, but in 4 weeks time that cost may be down to $100 as the rest of the market catches up.
Again, thanks for posting.
Regards,
Paul
Hi Paul
Thanks very much for that. Have you read the Black Swan Farming from Agile 2013 by Joshua Arnold and Ozlem Yuce? It describes some CoD scenarios similar to your own. It’s at http://costofdelay.com/black-swan-farming-using-cost-of-delay/ and https://docs.google.com/document/d/1COg4UbmPWJTnQop1BJ8CLTiBlYKbM-ZAgErH8bIWEd8/pub
Thanks
Steve